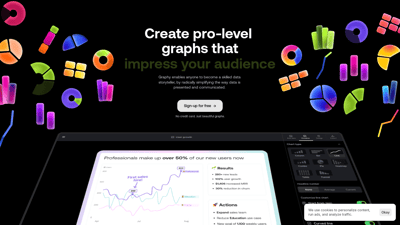
Graphy is a powerful AI-driven tool designed to transform the way you present and communicate data. With its intuitive interface and advanced features, Graphy enables users to create stunning, professional-level graphs that not only impress but also drive decisions and inspire actions. Whether you're a data analyst, marketer, or business executive, Graphy simplifies data storytelling, making it accessible for everyone. Join over 80,000 users who have harnessed the power of Graphy to enhance their data presentations and keep their teams aligned.
Graphy
Features of Graphy
Graphy is packed with features that make data visualization effortless and impactful:
-
AI-Powered Insights: Simply add your data, and Graphy's AI will generate insightful charts and explanations, ready for presentation in slides or Slack.
-
Intuitive Interface: The user-friendly design ensures that anyone can create beautiful graphs without a steep learning curve.
-
Integration with Google Sheets: Easily connect your data from Google Sheets, allowing for seamless updates and real-time collaboration.
-
Customizable Graphs: Create stunning, interactive graphs that can be tailored to fit your specific needs and branding.
-
Collaboration Tools: Share your graphs as interactive links, images, or embeds in various platforms like Notion, Slack, and Google Slides, facilitating teamwork and decision-making.
-
Fast Performance: Graphy is designed to be 80% faster than other data visualization tools, ensuring you spend less time creating and more time analyzing.
-
Rich Storytelling Features: Utilize visual annotations, trend lines, and goals to communicate insights effectively and focus attention on key data points.
-
Light/Dark Mode: Choose between light and dark themes for a comfortable viewing experience.
-
API Access: For advanced users, Graphy offers API access to integrate with other applications and automate workflows.
-
Beautiful Results: Impress your audience with visually appealing graphs that are easy to understand and share.
Graphy FAQs
What is Graphy?
Graphy is an AI-powered data visualization tool that simplifies the process of creating professional-level graphs and charts.
How does Graphy use AI?
Graphy’s AI analyzes your data and generates insightful charts along with explanations, making it easier to present and communicate findings.
Can I integrate Graphy with other tools?
Yes, Graphy integrates seamlessly with Google Sheets and can be shared on platforms like Slack, Notion, and Google Slides.
Is there a free trial available?
Yes, you can sign up for free without needing a credit card to explore Graphy's features.
How fast is Graphy compared to other tools?
Graphy is designed to be 80% faster than traditional data visualization tools, allowing for quicker chart creation and analysis.
Search 10000+ Useful AI Tools By What You Need.
Copyright © 2025 AListForAi All rights reserved