ChartAI is an innovative AI tool designed to simplify the analysis of complex datasets. With a user-friendly interface and a variety of visualization options, ChartAI empowers users to transform raw data into insightful charts and diagrams. Whether you're a data analyst, project manager, or business owner, ChartAI offers the tools you need to make data-driven decisions effortlessly. Explore features like Gantt charts, mind maps, and entity relationship diagrams to visualize your data in meaningful ways. Start your journey with ChartAI today and unlock the potential of your data!
ChartAI
Features of ChartAI
ChartAI offers a plethora of features designed to enhance data analysis and visualization:
-
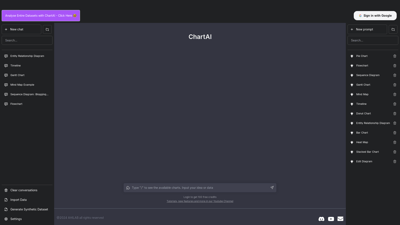
Diverse Chart Options: Users can create various types of charts, including pie charts, bar charts, heat maps, and more. This flexibility allows for tailored visualizations that suit specific data needs.
-
Entity Relationship Diagrams: Perfect for database designers and developers, this feature helps visualize the relationships between entities in a database, making it easier to understand complex data structures.
-
Gantt Charts: Ideal for project management, Gantt charts provide a visual timeline for project tasks, helping teams track progress and deadlines effectively.
-
Mind Maps: This feature aids in brainstorming and organizing ideas, allowing users to visually structure their thoughts and plans.
-
Data Import: Users can easily import datasets from various sources, streamlining the data analysis process.
-
Synthetic Dataset Generation: For testing and training purposes, ChartAI can generate synthetic datasets, providing users with the flexibility to experiment without compromising real data.
-
Customizable Settings: Users can adjust settings like temperature to control the randomness of outputs, ensuring that the results align with their specific requirements.
-
Clear Conversations: This feature allows users to manage and clear previous interactions, ensuring a focused and organized workspace.
-
Tutorials and Support: Access to tutorials and a dedicated YouTube channel ensures users can maximize their use of ChartAI effectively.
With these features, ChartAI stands out as a comprehensive tool for anyone looking to analyze and visualize data efficiently.
ChartAI FAQs
What is ChartAI?
ChartAI is an AI-powered tool designed to help users analyze and visualize datasets through various charting options.
How can I create a Gantt chart with ChartAI?
To create a Gantt chart, simply select the Gantt chart option from the dashboard, input your project tasks and timelines, and ChartAI will generate a visual representation for you.
Is there a limit to the number of charts I can create?
No, there is no limit to the number of charts you can create with ChartAI. You can generate as many visualizations as needed for your projects.
Can I import data from external sources?
Yes, ChartAI allows users to import data from various external sources, making it easy to analyze existing datasets.
What support options are available?
ChartAI offers extensive tutorials, a YouTube channel, and a community Discord for user support and engagement.
Search 10000+ Useful AI Tools By What You Need.
Copyright © 2025 AListForAi All rights reserved